Binarization board
This board is meant to visualize the behavior of the adaptive binarization algorithm. According to the current location, it displays the context information and the resulting threshold on pixel level.
It is effective only when run on the initial gray image.
Table of contents
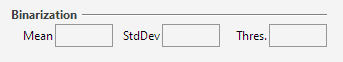
Mean
Average value of all pixels read in the vicinity of the selected location.
StdDev
Standard deviation value of all pixels read in the vicinity.
Threshold
Computed threshold value based on mean and deviation in vicinity, to compare with pixel level at selected location.