Data display modes
In the sheet panel we can choose between 3 display modes, that are effective in the Data tab:
 The physical mode displays in the background the sheet sections of pixels (pale blue for vertical sections, pale pink for horizontal sections) and in the foreground the current detected inters colorized according to their recognized shape and quality grade.
 The combined mode is a combination of the physical and logical layers.
It displays the logical interpretations in a translucent manner on top of the physical pixels, to ease the visual detection of any discrepancies. The logical mode displays only the logical score entities (inters).
It represents the current transcription of the original image, annotated by informations such as system number, measure number, time slot offset, etc.
Using menu Views | Switch layers or F12 function key or the dedicated toolbar icon (//), we can cycle through these 3 different modes: Physical / Combined / Logical.
| Mode | Data tab |
|---|---|
| Physical mode | 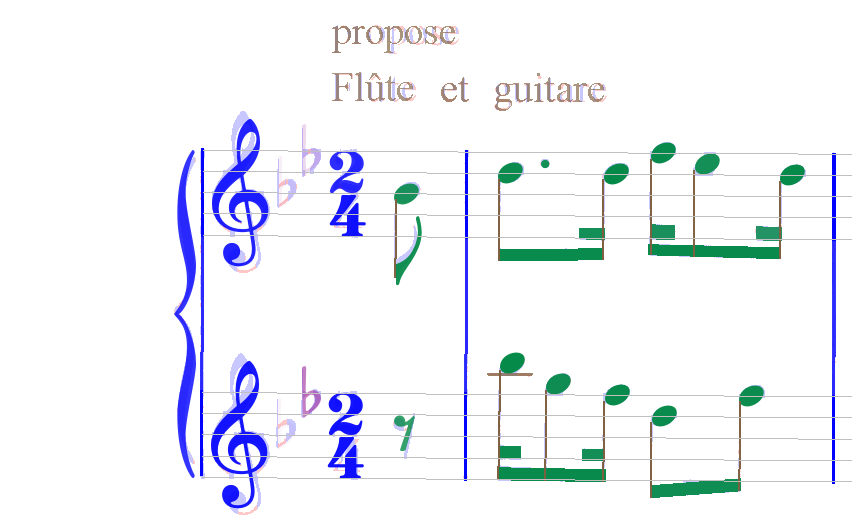 |
| Combined mode | 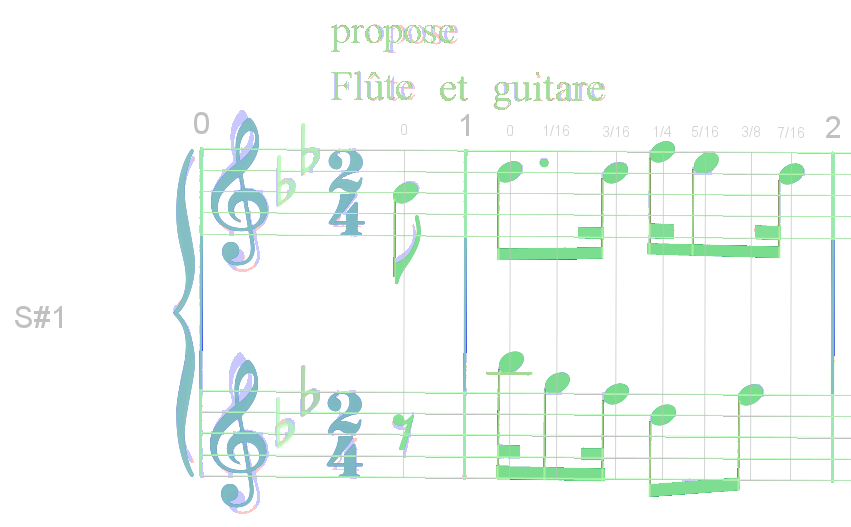 |
| Logical mode | 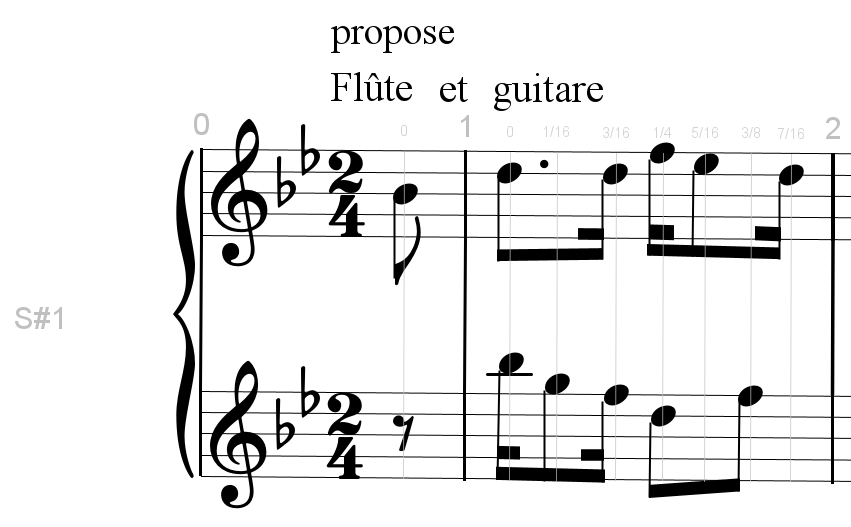 |
The other tabs are not impacted by the display mode.
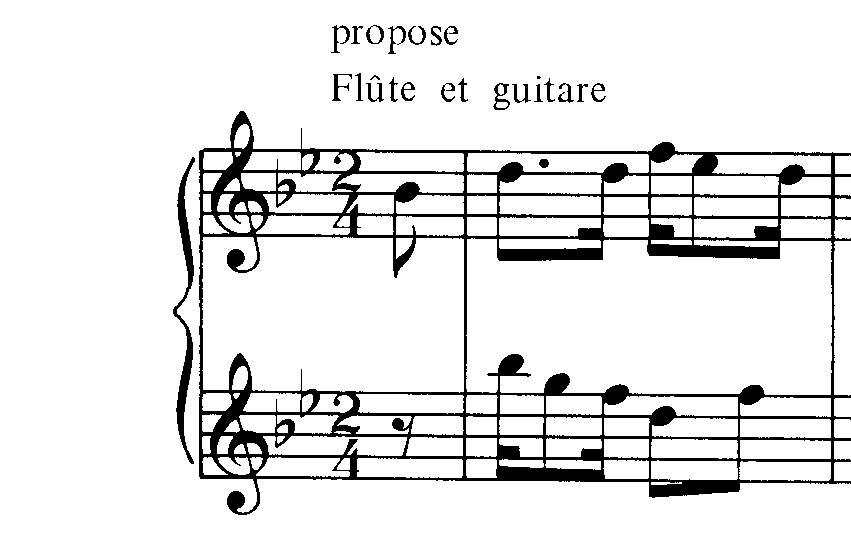
Notably, the Binary tab (which was mode-sensitive in previous Audiveris versions) now remains unmodified, so that it can instantly be used as a reference via a simple click on its tab:
| No mode impact | Binary tab |
|---|---|
 |